
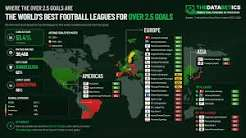

The 2017/18 Ligue 1 season produced 1,033 goals across 380 matches, an average of 2.72 goals per game, which is comfortably above the 2.5‑goal benchmark that anchors one of the most popular betting markets. For anyone analysing over/under 2.5 goals, that average immediately signals a league tilted slightly toward overs, but the real edge comes from understanding how those goals were distributed between teams, game states, and specific fixtures rather than treating the league as uniformly high‑scoring.
Why Over/Under 2.5 Is a Logical Lens for Ligue 1 2017/18
The over/under 2.5 market works as a clean way to translate the league’s scoring environment into binary decisions. In 2017/18, the combination of an attacking superpower in Paris Saint‑Germain and several high‑output contenders pushed Ligue 1’s goals per game higher than in many previous years, and later articles from the league have referenced that era as a benchmark for high‑scoring campaigns. For bettors, this context matters because it shifts the baseline odds: in a 2.72‑goal environment, a “fair” over 2.5 price is lower than in a league where the average sits near 2.3.
However, that average masks large differences in style and quality between clubs. Some teams consistently played in open, high‑variance matches, while others preferred structured, defensive football that kept totals down despite the broader trend. Over/under 2.5 becomes a particularly useful lens when it is applied selectively—leaning into those team‑level tendencies and match contexts—rather than as a blanket rule that “Ligue 1 is an over league now.” The task is to turn real data from 2017/18 into a map of where overs and unders made the most sense.
The Raw Scoring Profile: What Do 1,033 Goals Actually Mean?
The headline figure from 2017/18 is that 1,033 goals were scored across 380 matches, giving an average of 2.72 per game. That number sits slightly above generic over‑2.5 thresholds and aligns with modern over‑2.5 goal tables that show an average league hit‑rate around the low‑to‑mid‑50% range in typical Ligue 1 seasons. In other words, if you had blindly backed over 2.5 in every match of a similar season, you would expect to be around break‑even before odds and margins, not automatically profitable or doomed.
What truly stands out is Paris Saint‑Germain’s contribution to that total. PSG scored heavily across all competitions and set a club record of 171 goals in official matches that season, underlining how their presence inflated both goals for and goals against in their fixtures. Their league games disproportionately pushed averages upward, while matches between low‑scoring or defensively compact sides remained closer to or below the 2.5 line. For over/under analysis, that asymmetry is crucial: the over 2.5 market in PSG games lived in a different statistical world than the same line in mid‑table or relegation clashes.
Mechanism: How League Structure and Top Teams Drive Totals
The mechanism linking Ligue 1’s 2017/18 structure to over/under outcomes rests on talent concentration and tactical response. PSG’s attack, headlined by Edinson Cavani, Neymar and others, forced opponents into extreme choices: either defending very deep with limited attacking ambition, or attempting to press higher and risking heavy defeats, as reflected in scorelines like the 8–0 win over Dijon. In the latter case, matches often sailed over 2.5; in the former, totals sometimes hinged on whether PSG converted chances efficiently or whether underdogs held out.
Beyond PSG, attackers such as Florian Thauvin for Marseille and Memphis Depay for Lyon contributed to strong scoring records for their clubs, making fixtures involving these sides more likely to reach three or more goals when conditions allowed. By contrast, teams built around low‑block defending and conservative game plans naturally suppressed shot volume and chance quality, producing a higher proportion of under 2.5 results. For bettors, recognising that the league’s 2.72‑goal average was the outcome of these interacting forces—not a uniform property of every team—was the first step in reading over/under lines intelligently.
A Data-Driven Lens on Over/Under 2.5 (Perspective: Data-Driven Betting)
Among the available perspectives, a data‑driven betting approach fits this topic best because it treats over/under 2.5 as a probabilistic outcome grounded in historical distributions rather than gut feeling. Contemporary over‑2.5 tables for Ligue 1 show that in typical seasons, around 53% of matches finish with three or more goals, implying near‑coin‑flip probabilities adjusted slightly toward overs. In a 2017/18 season with 2.72 goals per game, that proportion likely sat in a similar or marginally higher range once outliers like PSG games were accounted for.
Within that structure, each team carries its own over‑2.5 footprint. Over‑2.5 tables list, for every club, the percentage of matches that finished above 2.5 goals, revealing which sides were reliable “over teams” and which dragged totals down. In 2017/18, it is reasonable to infer that PSG, Lyon, and Marseille sat near the top of that ranking due to their attacking output and the volatility of their matches, while some lower‑scoring or defensively inclined teams hovered well below the league average. A data‑driven bettor uses those percentages, combined with odds, to estimate whether the market is under‑ or overvaluing the likelihood of three or more goals in any given fixture.
Team Archetypes and Their Over/Under Tendencies
While we may not have a complete 2017/18 team‑by‑team over table in front of us, we can use available goal and scoring information to build archetypes based on how different categories of teams likely interacted with the over/under 2.5 line. These archetypes help structure thinking when you look back at actual results or compare similar patterns in current seasons.
A useful way to summarise those archetypes is in table form:
| Archetype | Typical 2017/18 traits | Likely O/U 2.5 tendency |
| Elite high‑scoring contenders | PSG, Lyon, Marseille – strong attacks, open matches | Above‑average share of over 2.5 |
| Mid‑table, balanced sides | Mix of moderate attack/defence, variable tactics | Around league‑average O/U split |
| Defensive/relegation battlers | Low scoring, compact shape, limited attacking threat | Higher proportion of under 2.5 |
For bettors, the value of this table lies in focusing attention where mispricing is more likely. Markets generally adjust quickly to PSG’s high‑scoring profile, so the edge in their games is often small unless context (injuries, late‑season motivation) shifts dramatically. Greater opportunity usually lies in mid‑table and lower‑table fixtures where the archetype can mislead: a defensive side forced to chase a must‑win game might temporarily behave like an over‑team, while two usually open teams might turn cautious in a high‑stakes top‑four decider.
Using Sequences to Turn League Data into Match Decisions
Knowing that Ligue 1 2017/18 averaged 2.72 goals per game is only useful if you can translate that into a repeatable pre‑match process. A structured decision sequence helps ensure that each over/under 2.5 bet is anchored in concrete information rather than a vague sense that “this league scores a lot.” Tools and sites that provide over‑2.5 and goals‑per‑game tables demonstrate the types of inputs that matter: team‑level goal averages, over/under hit‑rates, and sometimes expected goals metrics.
A practical sequence to apply—either retrospectively to 2017/18 or to future Ligue 1 seasons—could be:
- Check both teams’ goals‑for and goals‑against averages, plus their individual over‑2.5 percentages over a substantial sample.
- Adjust expectations for context: title race, relegation pressure, fatigue, or coach changes that may alter tempo and risk levels.
- Incorporate stylistic factors: high pressing, transition play, defensive structure, and likelihood of late tactical risk‑taking.
- Compare your implied probability for over 2.5 against the market price and only bet when there is a clear gap.
This sequence reflects the cause‑and‑effect nature of the market. Team scoring data and styles shape goal probabilities, context modifies how aggressively those tendencies are expressed, and the final decision depends on whether odds understate or overstate what the numbers and context suggest.
Where UFABET Fits into Over/Under Implementation
Once a bettor has built a data‑driven framework for over/under 2.5 in Ligue 1, the choice of execution environment starts to influence results. When someone operates through a specific online betting site, the availability of alternative goal lines, historical odds, and quick filtering by league becomes part of the edge calculation. In that sense, any assessment of สูตรบาคาร่า ufa168 should emphasise whether its over/under menus, line movement display, and bet‑tracking tools make it easier to apply a structured Ligue 1 model across an entire season instead of encouraging sporadic, intuition‑driven bets whenever a well‑known team is involved.
Integrating over/under 2.5 with Live and Derivative Markets
Over/under 2.5 analysis does not exist in isolation; it naturally connects to other markets. For example, the same factors that drive a high‑probability over—two aggressive teams, weak defences, and high stakes—also elevate the chances of both teams scoring and certain correct‑score clusters. In Ligue 1 2017/18, PSG‑dominated blowouts and chaotic mid‑table games often produced scorelines like 3–0, 3–1, or 4–2, while defensive battles between relegation candidates more often landed on 0–0, 1–0, or 1–1. Bettors who saw over/under 2.5 as a gateway decision could then decide whether to express that view more precisely via related markets when odds justified the extra specificity.
Live betting adds another layer. A pre‑match lean toward over 2.5 can evolve into in‑play decisions if the match state diverges from expectations—say, a slow first half in a game projected to be open. Historic over‑2.5 profiles for the teams involved, combined with real‑time tempo, can guide whether to double down at improved prices or to step away. In a league where late goals are common, understanding which sides routinely turn 1–0 into 2–1 or 3–0 matters when assessing whether an in‑play over remains viable as minutes tick away.
How casino online Environments Affect Over/Under Strategy
For bettors who distribute their action across multiple competitions, including Ligue 1, the way their betting environment organises markets can support or undermine over/under discipline. When access is through a casino online website that embeds sports wagering alongside other games, the interface may prioritise short‑term entertainment or cross‑promotion over long‑term tracking of league‑specific strategies. A setup that allows easy sorting of past bets by league and market type, along with quick access to over/under lines and historical closing odds, helps a bettor see whether their Ligue 1 2017/18‑style approach to 2.5 goals actually produced value or whether adjustments in team archetypes, context weighting, or stake sizing are needed.
Summary
Ligue 1 2017/18 delivered 1,033 goals in 380 matches—2.72 per game—creating a scoring environment where the over 2.5 line was naturally live but still required careful team‑ and context‑based analysis. Elite attacks, especially PSG’s record‑setting output, pushed many fixtures into high‑scoring territory, while defensive or relegation‑focused sides kept others tightly constrained, producing a spectrum of over/under tendencies that league‑level averages alone could not capture. For data‑driven bettors, the real edge lay in segmenting teams into archetypes, combining their over‑2.5 profiles with tactical and motivational context, and then using that structure—implemented through a supportive betting environment—to decide when market prices on the 2.5 line genuinely diverged from the probabilities implied by the 2017/18 data.